As reported in #4713, the Footprint component is slow af because it attempts to find many points to ungarrison or spawn units near the footprint.
In case of a sunken ship, that can cause a freeze of several seconds.
This means it by far outweights the cost of all other simulation components and therefore MUST be profiled.
If that lag is fixed some day, we should still have this Profiler call to exclude regressions.
Details
Details
- Reviewers
vladislavbelov - Commits
- rP19973: Profile Footprint calls that can easily consume 90% of the simtime on a turn…
- Trac Tickets
- #4713
Run the attached danubius a22 replay with that patch in a22 to reproduce the example graph.
Diff Detail
Diff Detail
- Repository
- rP 0 A.D. Public Repository
- Lint
Automatic diff as part of commit; lint not applicable. - Unit
Automatic diff as part of commit; unit tests not applicable.
Event Timeline
Comment Actions
Build is green
Updating workspaces.
Build (release)...
Build (debug)...
Running release tests...
Running cxxtest tests (306 tests)..................................................................................................................................................................................................................................................................................................................OK!
Running debug tests...
Running cxxtest tests (306 tests)..................................................................................................................................................................................................................................................................................................................OK!
Checking XML files...
http://jw:8080/job/phabricator/1833/ for more details.
Comment Actions
Executing section Default...
Executing section Source...
Executing section JS...
Executing section XML GUI...
Executing section Python...
Executing section Perl...
http://jw:8080/job/phabricator_lint/377/ for more details.
Comment Actions
It compiles and works on Windows 8.1. Other components use the PROFILE3 for the profiling.
Comment Actions
Thanks for the review and quick testing!
So the only real question for this diff was whether to use PROFILE", 'PROFILE2 or PROFILE3.
According to EngineProfiling, the first one is for calls that occur frequently,
the second one for calls that occur rarely bug cause spikes,
the third one for both simultaneously.
In the trac ticket we see a graph that was generated with profiler1, so it can only be the profiler1 or profiler3 call that we want.
Since we also want it in the profiler2 system (live-tracking), we need profiler3.
Quoting the document:
The profiler is relatively expensive; you usually shouldn't put PROFILE in code that will be called thousands of times per frame, since the profiling overhead will dominate the code you're trying to measure.
Don't see the footprint component being called thousands of times per frame (only when spawning / ungarrisoning units).
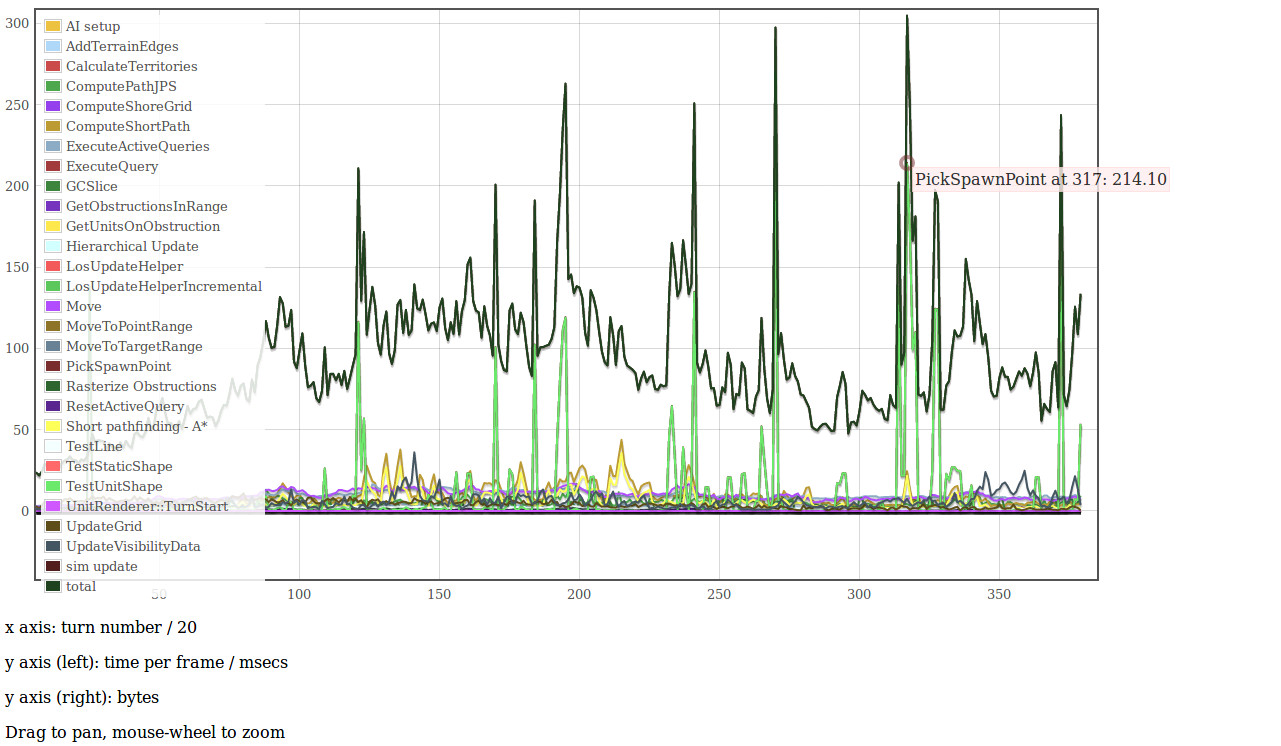
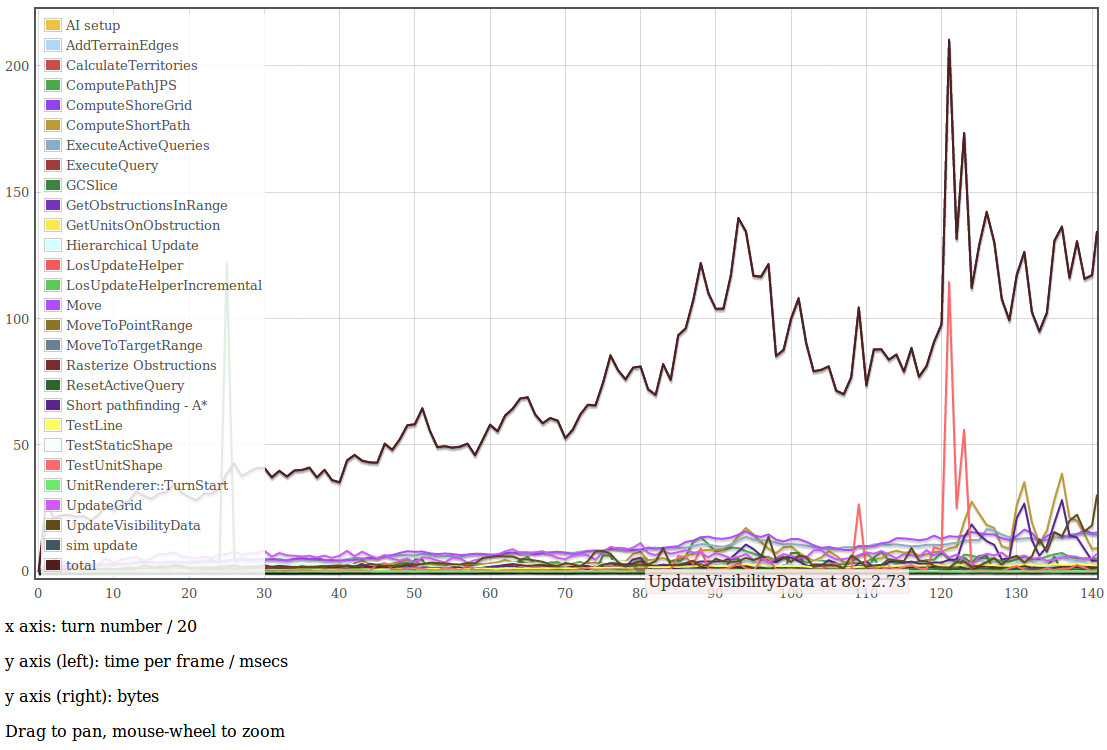
I've created graphs with a PROFILER2 and PROFILER3 call on the danubius replay attached in the ticket that has the "sunken ship" lagspikes.
Profiler3:
Profiler2:
We observe that
- the Profiler2 call indeed doesn't show up in the non-visual replay profiler data, so we need Profiler3
- The total simtime curve remains the same, so these footprint lagspikes don't render the graphs less readable than they already are
- the TestUnitShape profiler calls induced by the Footprint component are already tracked, but it is not clear to the reader where they are coming from, so the addition is relevant.